

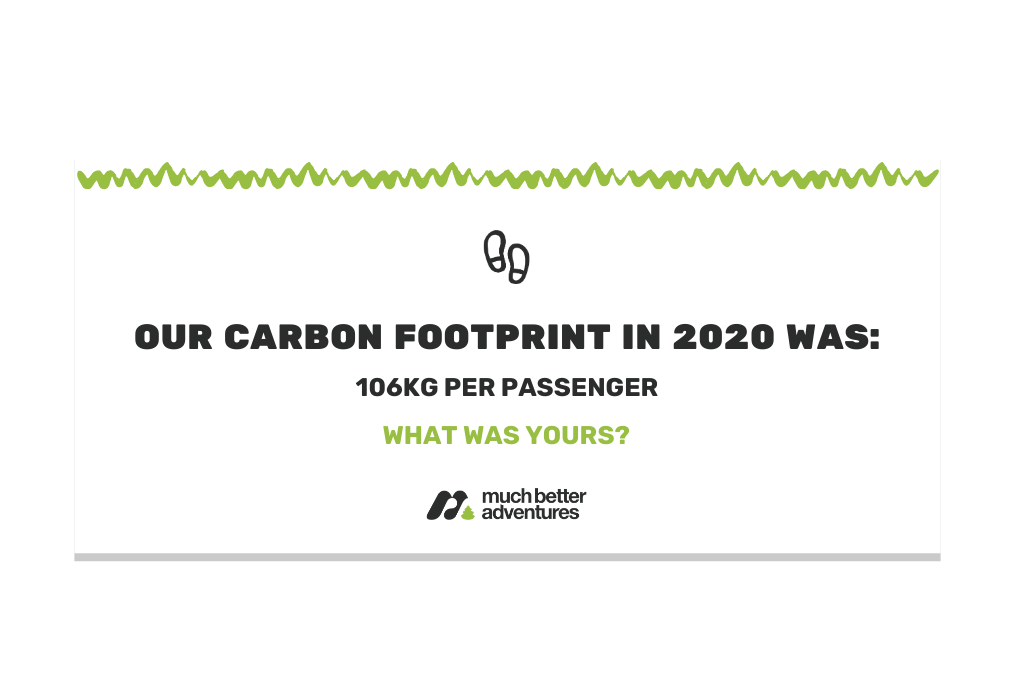
On every trip on Much Better Adventures you’ll now see a ‘carbon footprint’ section where you can view the estimated carbon emissions per person arising from a spot on our trips.
It’s inspiring to see companies in other industries, such as Patagonia and Oatly for example, measuring and sharing their impact and it’s clear that the travel industry has been behind the curve on this front.
We believe that must change, quickly.
After all, you can't manage what you don't measure.
Our hope is that by releasing both our measurements and the methodology we used, we will encourage other companies to more easily follow suit, and build on what we’ve done so far.
We're using this data to be able to work with all our hosts to develop long term carbon reduction plans. For every person booked with us since 2016 we’re also planting enough trees to suck at least 2x more carbon out the atmosphere than is emitted by their trips, and funding re-wilding projects worldwide to help protect important keystone species from extinction. See our Carbon Action Plan.
We’re openly sharing both the headline results here (which we'll update annually) as well as the method we used (below).
We hope that this transparency will ultimately empower all travellers to make informed decisions about how and where they roam in future.
Sustainability is becoming a key consideration for travellers. If you run a travel company (or need to persuade the decision makers at one), it may help to know that in 2011, only 19% of people said they were more likely to choose one company over another based on their environmental record, that doubled to 38% in 2020 (ABTA).
METHODOLOGY: BRIEF OVERVIEW
Approach
We worked closely with a carbon consultancy to develop the initial framework. We’ve since had it peer reviewed by partners and experts across the industry, including a number of members of Tourism Declares a Climate Emergency.
From the outset our goal was to develop an accurate footprint analysis whilst also keeping the process manageable, achievable and replicable.
We therefore recognise that there are elements to the methodology that could be enhanced and areas we could have gone deeper - we've highlighted some of these below. We’ve taken a view that ‘done is better than perfect’, and believe the model gives a reasonable degree of accuracy as well as a clear baseline from which to continually refine and improve year on year.
Where we made assumptions we attempted to err on the side of over estimation. Below we set out our assumptions, and welcome feedback to improve the model for future years. Please send all feedback, comments and questions to carbon[@]muchbetteradventures.com.
We hope that by sharing our model and method it can serve as a starting point to help other travel companies to efficiently develop their own carbon calculations too.

Summary of inclusions
Scope 1 and 2:
- Electricity and gas from office and home working
Scope 3:
- Customer flights to/from destination
- All transport in destination (land, sea and air)
- Accommodation
- Food
- Contingency for supply chain emissions and commodity purchases
All carbon conversion factors are sourced from Defra 2019 or Defra 2020 unless stated otherwise below and in the 'carbon factors' sheet on the example model.
METHODOLOGY: THE DETAILS
The notes below breakdown the approach, key assumptions and sources used to build the framework and should serve to aid anyone looking to evaluate our approach or learn from it.
Transport
We mapped the total land and sea transport routes for all the trips we sell, including transfers from the closest airport to the arrival/ departure meet point, and transport during the trip such as boat journeys, driving to/from hike start points, kayak put in points or to the next night's accommodation.
This gives us a total KM travelled on each departure. Exact routes measured will not always be 100% accurate as they can vary based on local conditions, but will give a close approximation.
For land transport, we estimated the average number of minibuses needed per departure, based on the average group size for that trip, and assuming 8 people (travellers and guides) fit in each minibus. These figures are editable in the template, as sometimes trips will use a different type of transport (e.g taxi or a larger bus to the airport).
By multiplying total kilometres travelled by the number of minibuses gave us a total minibus distance travelled for each departure. Using the appropriate Defra conversion factor we can estimate carbon emissions.
For boat travel, we took the total km travelled and multiplied it by the Defra conversion factor for the average passenger kilometre on a car ferry (a worst case estimate, as often the passenger will be a foot passenger on a smaller and more efficient boat e.g sail boat or RIB).
The total figure for land and boat transport is then added together, and 10% is added on top of the resulting figure as a contingency to allow for incidental and spontaneous journeys not in the itinerary, diversions, refuelling stops and other additional factors.
Future improvements:
- Log specific types of vehicle used on each leg of each trip
- Log specific fuel type and fuel efficiency of individual vehicles.
Food
First the total number of eating days is calculated as the total number of people (travellers and guides) taking part in each trip multiplied by the number of nights of each trip, plus one (to add an extra day per trip).
The total number of eating days for each trip is then split into the proportions of people that follow meat eating, vegetarian and vegan diets. Based on the dietary requests specified by our customers, 89% of travellers (and guides) eat meat, 11% do not (vegan 2% or vegetarian 9%).
Finally, the total eating days for each diet on each trip is multiplied by the age-and-sex-adjusted mean kgCO2e/day, taken from a 2014 study of the ‘Dietary greenhouse gas emissions of meat-eaters, fish-eaters, vegetarians and vegans in the UK'. It gives 5.63 kgCO2e/day for meat-eaters (we assume meat-eaters are Medium meat-eaters at 50–99 g/day), 3.81 kgCO2e/day for vegetarians and 2.89 kgCO2e/day for vegans.
Future improvements:
- Log sample menus for each trip individually and estimate carbon footprints for each item on each menu.
- Identify different data sources to use for different countries, instead of assuming the UK diet to be reflective of worldwide patterns. We anticipate using the UK as a basis will be an overestimation due to the high volume of imports to the UK compared to many countries.
Accommodation
Accommodation used on our trips have been categorised as follows.
Camping: Campsite, Wild camping.
Hostel: Hostel, Mountain hut, Teahouse, Yurt, Tipi
Hotel: Apartment, Homestay, Hotel, Guesthouse, Riad, Boat
A breakdown of the Accommodation categories used on each trip is input (#days camping, #days in hostel, #days in hotel). Each category is then multiplied by the number of travellers & guides on each trip to get total nights in each category. Finally, the number of nights is multiplied by the appropriate conversion factor for the country and category of accommodation, to get the estimate carbon emissions.
The appropriate carbon conversion factor for accommodation depends on accommodation category and country:
Camping: The methodology assumes 120g LPG (propane or butane) per person per day for camping and multiplied by the appropriate Defra fuel factor.
Hotels: Defra 2020 factors for the appropriate country are used. If the country is not covered in Defra factors, the factor is sourced from Travel and Climate. If no factor is available in either, the closest country match is chosen from DEFRA figures.
Hostels: emissions are assumed to be 25% of those of a hotel room, based on the ratio of ‘lower climate impact’ figures to ‘average hotel in the country’ figures from Travel and Climate.
As figures are on a per room basis, the figures are adjusted by a multiplier to to give figures on a per person basis. Our figures are based on an average of 80% of room occupancy being twin, and 20% of rooms only containing one person.
Future improvements:
- Identify different data sources that can increase accuracy of estimated emissions for each category, in each country.
- Request individual carbon footprint audits for each specific accommodation used.
Guides and staff
The number of guides and support staff required per trip is input as a traveller:guide ratio. Each guide or staff member is treated as an extra person for estimating carbon emissions of accommodation, food, activities, land transport and airport transfers. This will be an overestimation as not all staff will be present for all those aspects.
Future improvements:
- Log the exact number of staff on each element of each trip individually, rather than as an average across all the trips that year.
Customer flights
Flight distances were estimated for a sample set of over 4500 passengers, using the assumption they flew return in economy class from London to the nearest major airport.
The Defra carbon factors used take account of RF (Radiative Forcing), the class of travel (per passenger impacts being linked to space taken up on the aircraft) and distance travelled, with different factors for domestic, short and long haul categories.
Staff travel
Details of all flights, train, bus and car journeys taken by our team during the year are logged and their emissions calculated.
Flights use the same Defra carbon factors as customer flights (see above).
Rail, bus and taxi travel is assessed from total km travelled using the appropriate Defra carbon factors.
Contingency
Contingency is added based on the relative contribution of different purchased commodities to the travel carbon footprint of travellers from high income countries, from “The carbon footprint of global tourism” paper (Lenzen et al 2018, Nature Climate Change, Vol 8:522, June 2018, pg 522–528, Fig 4).
Relevant commodities for the trips Much Better Adventures customers undertake were assumed to include goods, mining, agriculture, construction and “other”. We assume there is no rail transport, services, and transport (other than that which has been calculated). We consider “goods” e.g. purchasing of souvenirs, gifts etc to be 40% lower for adventure trips than for other types of holiday (e.g. resorts, cruises, city breaks). This results in a contingency added to all trips of 20%.
Office
We have taken an estimate of energy used for heating, lighting and running of equipment in both our serviced offices (shared with other companies) and home working spaces.
The offices use electricity and natural gas for heating, and are air-conditioned. Both offices are assumed to be a ‘typical’ rather than ‘best practice’ build and operation and calculated using the following data source.
Some employees have their residence designated as their permanent office. Typical Domestic Consumption Values (TDCVs) for 2019 are obtained from Ofgem.
Assumptions include “medium” usage (natural gas 12000kWh/year, electricity (Profile Class 1) 3100kWh/year), and home office space takes up 1/10th of the residence, and is in use for that purpose 60% of the time. Thus consumption per home office worker = 720kWh of gas/year and 186kWh of electricity/year.
Other scope 3 (supply chain) aspects, e.g. Transmission and Distribution of electricity, well-to-tank, waste and water management, purchase of goods/services, etc. are assumed to be negligible and excluded from scope. F-gas emissions related to refrigerants/fire suppressants in the office space are assumed to be negligible and excluded from scope.
Get in touch
We're happy to share our learnings with others if it can be helpful. Please send all feedback, comments and questions to [email protected].
We recommend using the services of an expert consultancy to develop your calculations, as each company is different and will have their own bespoke requirements.
References*
Flights
London to New York return flight is calculated using Defra 2020 conversion factor for long haul economy class, including radiative forcing. 0.14615 kg CO2e per passenger km x 11080km = 1619kg CO2e
Car emissions
1000 miles in a car is calculated using Defra 2020 conversion factor for the average petrol car. 0.28052kg CO2e x 1000 miles = 280.52 kg CO2e
Carbon sequestration rates
These vary according to a number of factors including location, type of vegetation, planting density and carbon density in forests at different stages of maturity. This is a conservative prediction arrived at based on the existing research literature.
These are the 2 references that are most relevant:
Seedrea, M., Jandaa, P., Trotsiuka, V., Hedwall, P., Morrissey, R.C., Martin, M., Bače, R., Čada, V., Svoboda, M. Biomass carbon accumulation patterns throughout stand development in primary uneven aged forest driven by mixed severity natural disturbances. Forest Ecology and Management 455, 117676 (2020). https://doi.org/10.1016/j.foreco.2019.117676
Bernal, B., Murray, L.T. & Pearson, T.R.H. Global carbon dioxide removal rates from forest landscape restoration activities. Carbon Balance Management 13, 22 (2018). https://cbmjournal.biomedcentral.com/articles/10.1186/s13021-018-0110-8