


Here at Much Better Adventures, we love maps. We love the way you can cosy up with them (like a mug of tea) and dream of future adventures. We love visualising the crinkles of a new destination – and of course how useful they are to find your way when you’re actually there!
Poring over a map is a bit like exploring the endless possibilities of a choose your own adventure book (which you may or may not have spent hours of your life trying to beat without coming to a sticky end, or using all the fingers of one hand to hold open alternative futures at once. Seriously, has anyone completed one without cheating?).
In the UK, we’re incredibly lucky to have a huge and comprehensive mapping system across every inch of our little islands to fuel your UK hiking adventures. You can get a map for anywhere in the UK and know where you are to minute precision.

To put it into perspective, all Mountain Leaders must be able to navigate to within 1mm precision on a map, using only a map and compass (that’s to within 10m on the ground). You can do all that without a GPS thanks to the detail on the maps and the wonderful human brain.
Of course, other brands of map are available, but we’re going to focus on telling the somewhat remarkable story of how Ordnance Survey in England started, and how we ended up with such a comprehensive mapping system of the UK.
Ordnance Survey means…?
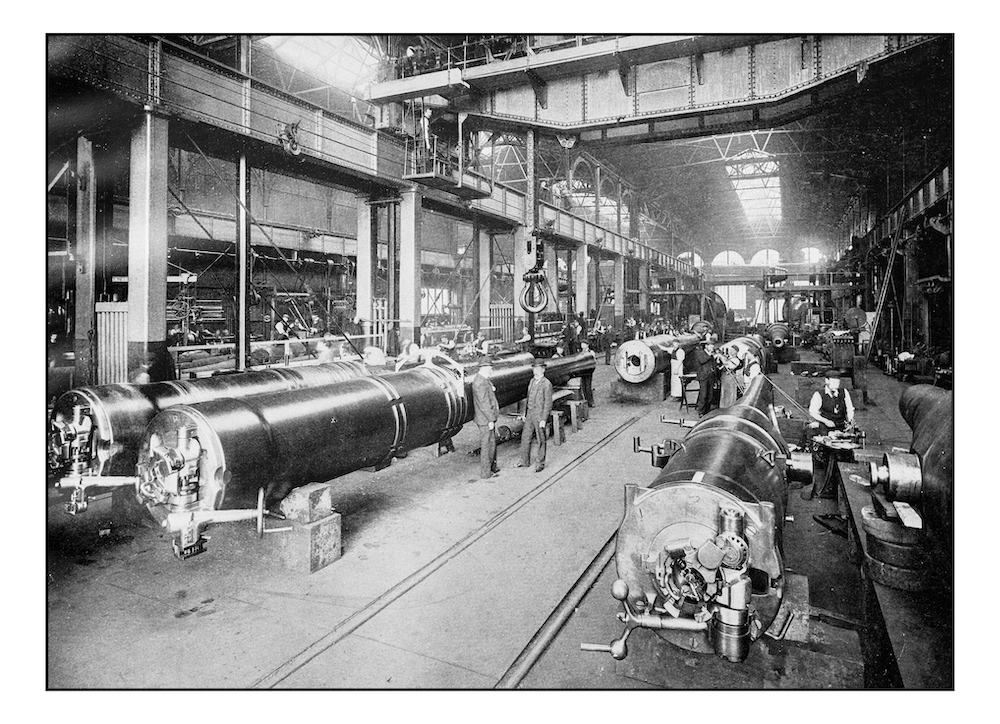
Have you ever wondered why Ordnance Survey has such a weird name? I mean, ordnance, that’s like bombs isn’t it? Bit of a strange thing to call a company that makes maps. But yes, you’d be completely right. Ordnance Survey was essentially started by the military for the purpose of costal defence.
Way back in 1745, the Board of Ordnance was charged with mapping the Scottish Highlands in case of a further rebellion by the Scots – thanks guys. A chap called William Roy, who’d never been in the military and was only 21, was given the task to map the whole area starting 1747. We imagine it was a bit like sending the work experience student to make coffee, or giving the cocky new graduate hire the job literally no one wants to do. Possibly with the hope of watching them flounder.

But, to his credit, William Roy did not flounder. It took him eight years to complete the “Great Map” at a scale of today’s 1:36 000 (1.75 inches to a mile) but he did it. He recorded roads, hills, rivers, types of land, settlements – and we imagine returned to his boss with a smug grin upon completion. Joking aside, his methods were revolutionary and paved the way for following surveyors and map-makers. An accurate map was incredibly novel concept!
Baguettes vs tea
Roy’s next task, in 1784, was to solve a dispute between the French Academy of Sciences and the Royal Society of London. The French claimed that the latitude and longitude differences between the Paris and Greenwich Observatories were incorrect. You can imagine the Round the World in 80 Days style uproar that this caused amongst the gentlemen of the Royal Society. Something had to be done.
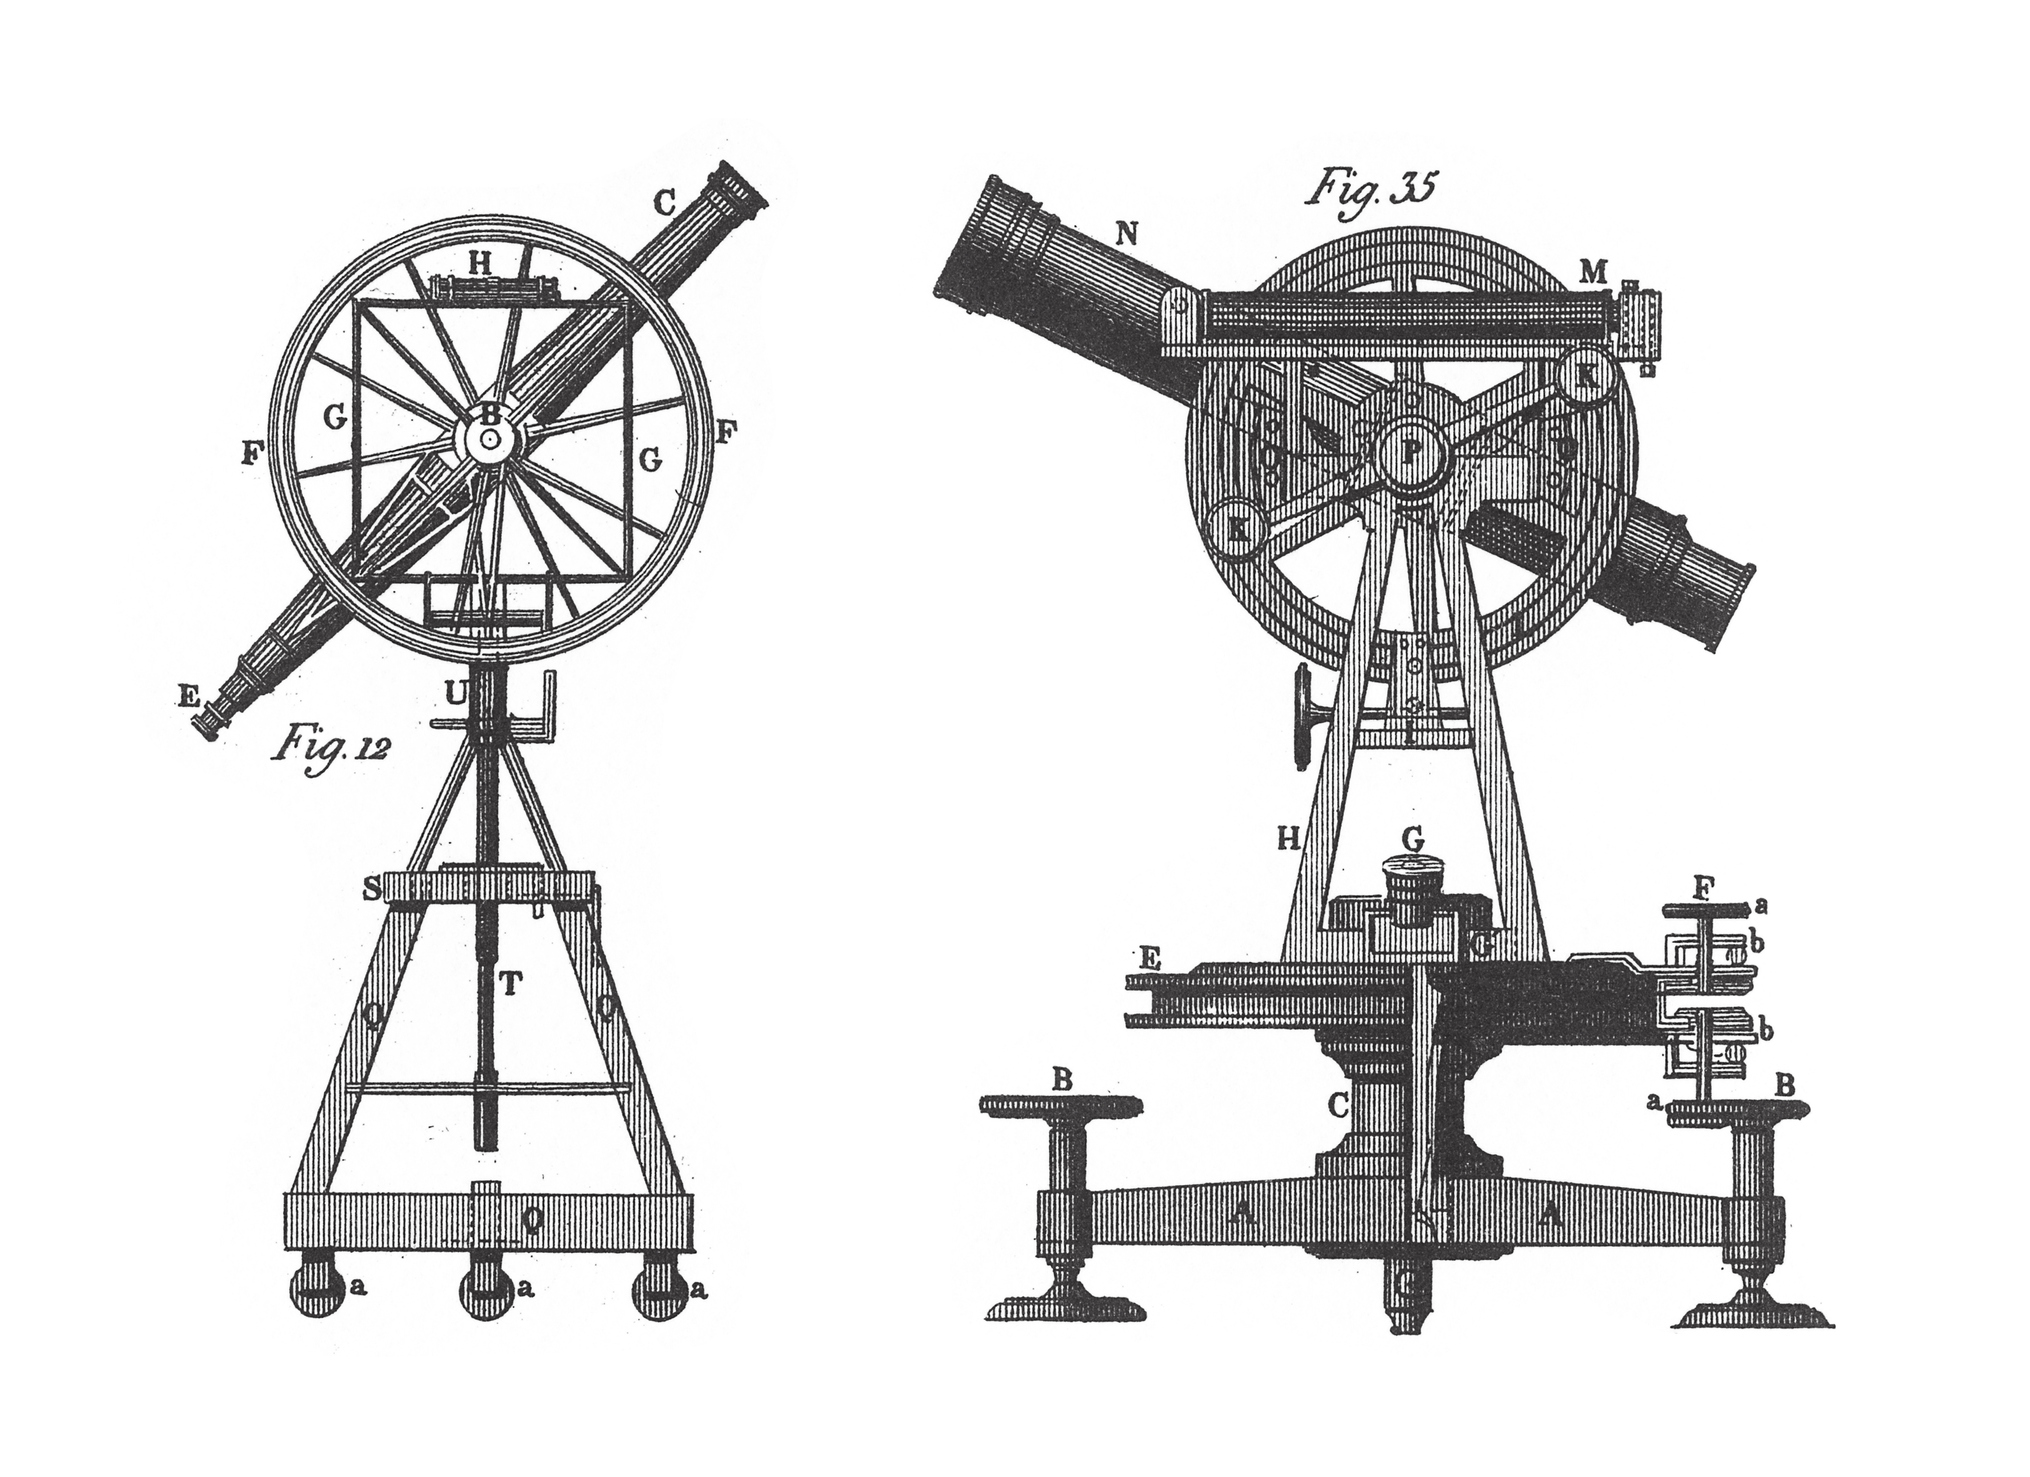
To solve the problem, they had to build and use the biggest theodolite that had ever existed (for our purposes, consider a theodolite as a great big, three dimensional protractor – that looks like a telescope). It only took them three years to build one. History doesn’t seem to record whether the French or English were right, but what it did do is make the English realise that knowing accurate distances and positions was pretty important. They bought another theodolite and in 1791 embarked on Roy’s lifelong mission: to make an accurate map of the entire of the Great Britain.
Attack of the Triangles
How do you make an accurate map? The answer, much to your GCSE Maths teacher’s delight, is with trigonometry and triangles. If you were that kid who asked, “But Miss, why do we have to learn Pythagoras’ Theorem?” then here’s your answer. To make good maps, you use triangulation. First you start with a straight line, known as a Base Line. You do this by literally measuring out a line on the floor: the base line for the first Ordnance Survey maps was a 5 mile line in Hounslow Heath, measured using rods and chains.
Ordnance Survey started out doing just the coastal areas, in case the French decided to attack.
Then, once you have a line, you need to find a distant point that you can see from both ends of the line. Go to that point with your angle measurer and measure the angles from where you are to either end of your base line. You might have to use lights at the end of them to help line things up. Then, thanks to good old trigonometry, you can work out the distances between your point and either end of the baseline. Yep, a triangle. Now you can use any of those three lines as baselines – and so the triangles spread across the whole area.
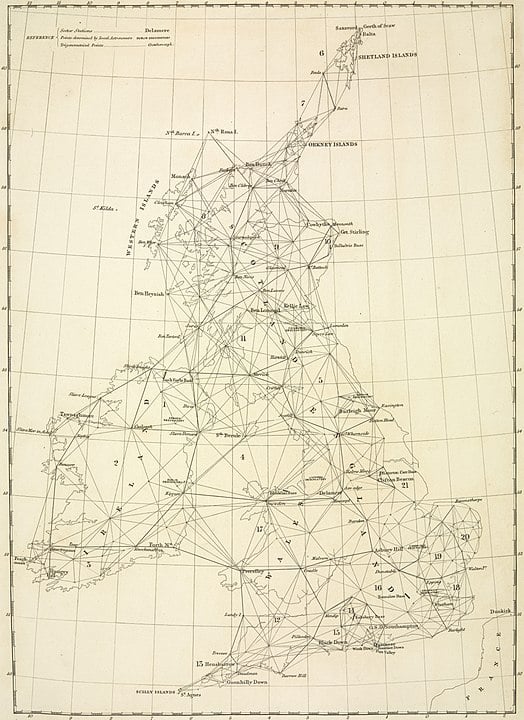
The Triangulation of Great Britain was literally that. They covered it in triangles (on a diagram, of course, not actually drawn out on the floor). You can take a look at it here if you’re curious!
As you can imagine, this process took rather a long time – like decades. Ordnance Survey started out doing just the coastal areas, in case the French decided to attack. Once the war was over, landowners started to offer up landmarks on their estates to be used as part of the triangulation process. Hoping for some fame and small talk at parties, perhaps.
Ordnance Survey release a map!
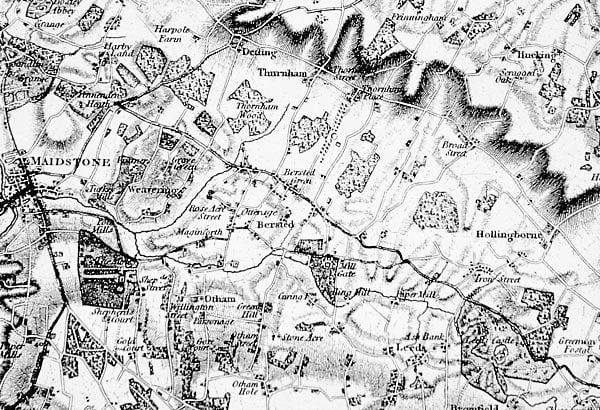
The first map Ordnance Survey published was of Kent in 1801. Not because the world revolves around London, but because Kent is the flattest place they could find to measure out the initial Base Line. Sorry about that Norfolk. The map took three years to make and was printed using copper plate (etch the whole thing backwards, ink it up and then place the paper on top). It was called “An Entirely New & Accurate Survey Of The County Of Kent”. You can view it here. About four years later, the map of Essex came out.
Within about 20 years, they’d mapped about a third of England and Wales. Next stop, the British Isles! “It won’t take long,” they thought. “Fifty years ought to be long enough.” Famous last words. It wasn’t until 1870 that they managed to complete the entire first series of OS maps. Can you even imagine committing to a project that long nowadays?
 Emily Woodhouse
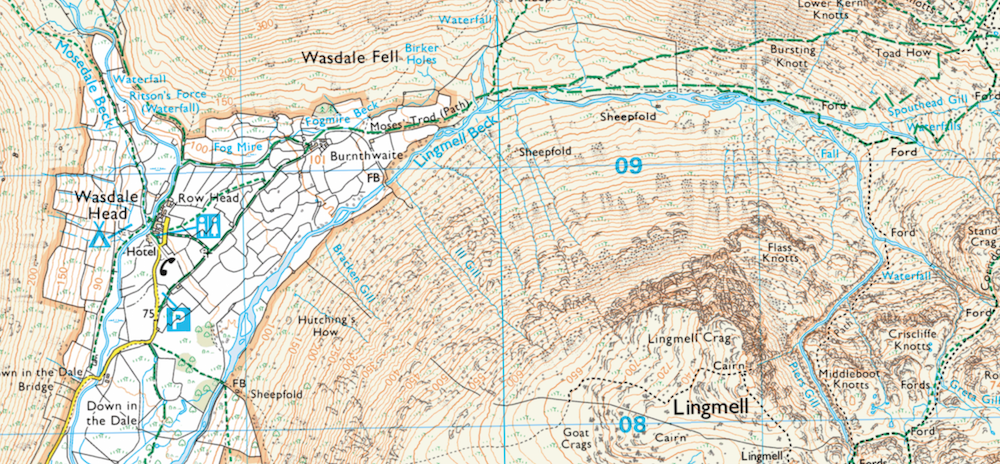
Over the sea to… Ireland
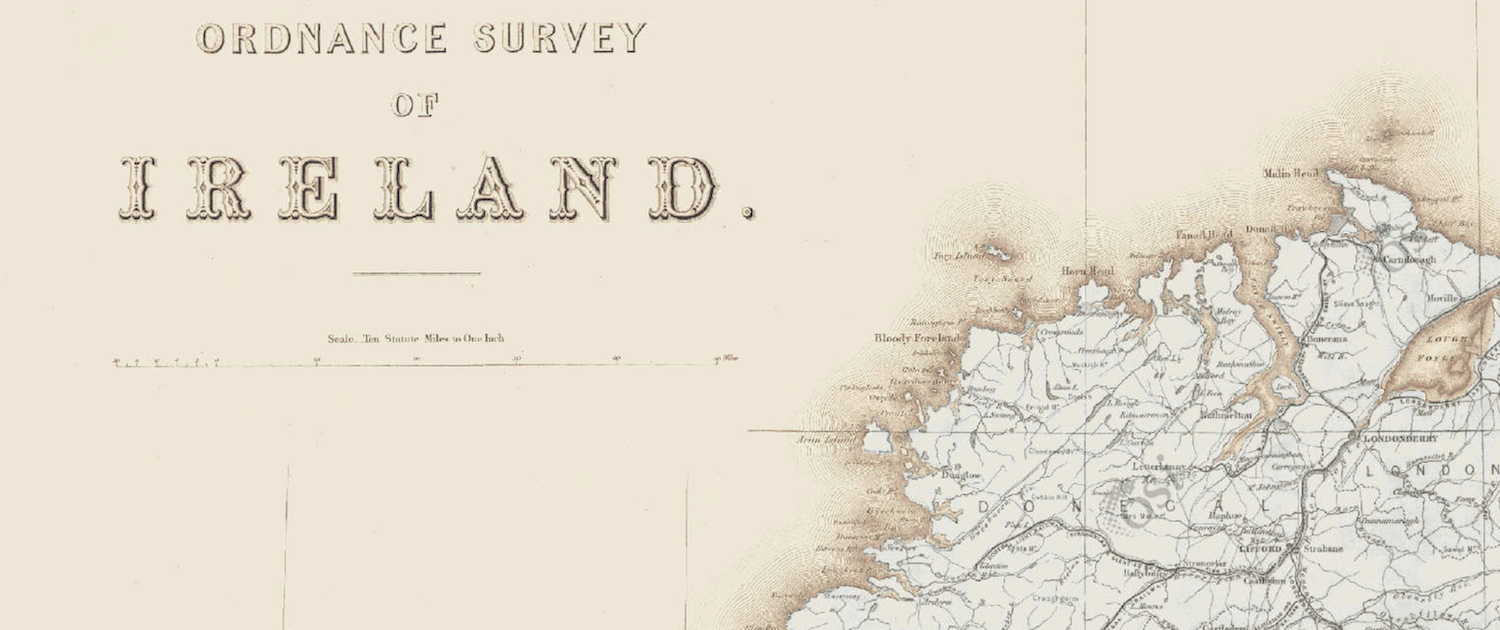
Once Great Britain was successfully mapped, Ordnance Survey sent their surveyors over the sea to Ireland to continue the project. They were really there to get accurate maps to enforce taxation, but we’ll forgive them because they used to throw plum pudding parties at the end of each season.
If you happen to have a lot of time on your hands at the moment, there’s a play called Translations by Brian Friel which pokes fun at OS surveyors being unable to translate Irish place names. Think The Englishman Who Went up a Hill but Came Down a Mountain (a film in which Hugh Grant plays himself, but this time in a small Welsh village).
Speaking of which – Thomas Colby, the man in charge of the plum pudding parties, was the first to introduce heights to Ordnance Survey maps. Can you imagine a map without a contour? He did this by commissioning a national geodetic levelling survey (as one does) in relation to the average sea level in Liverpool.
We want more maps – and better
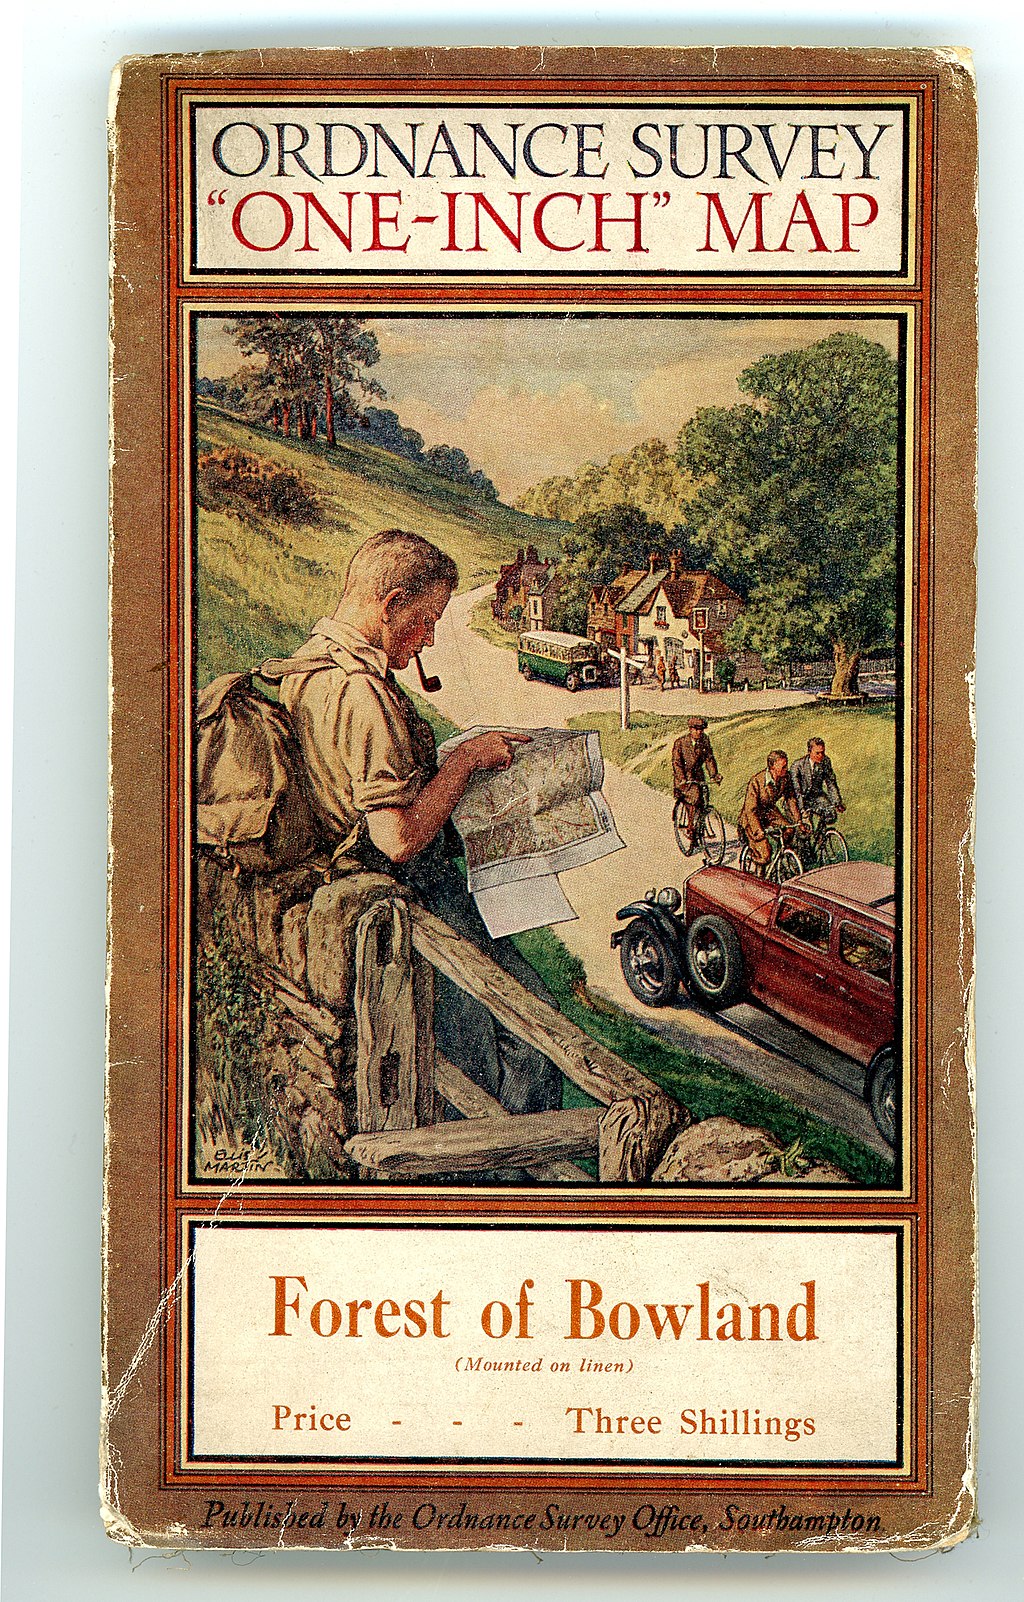
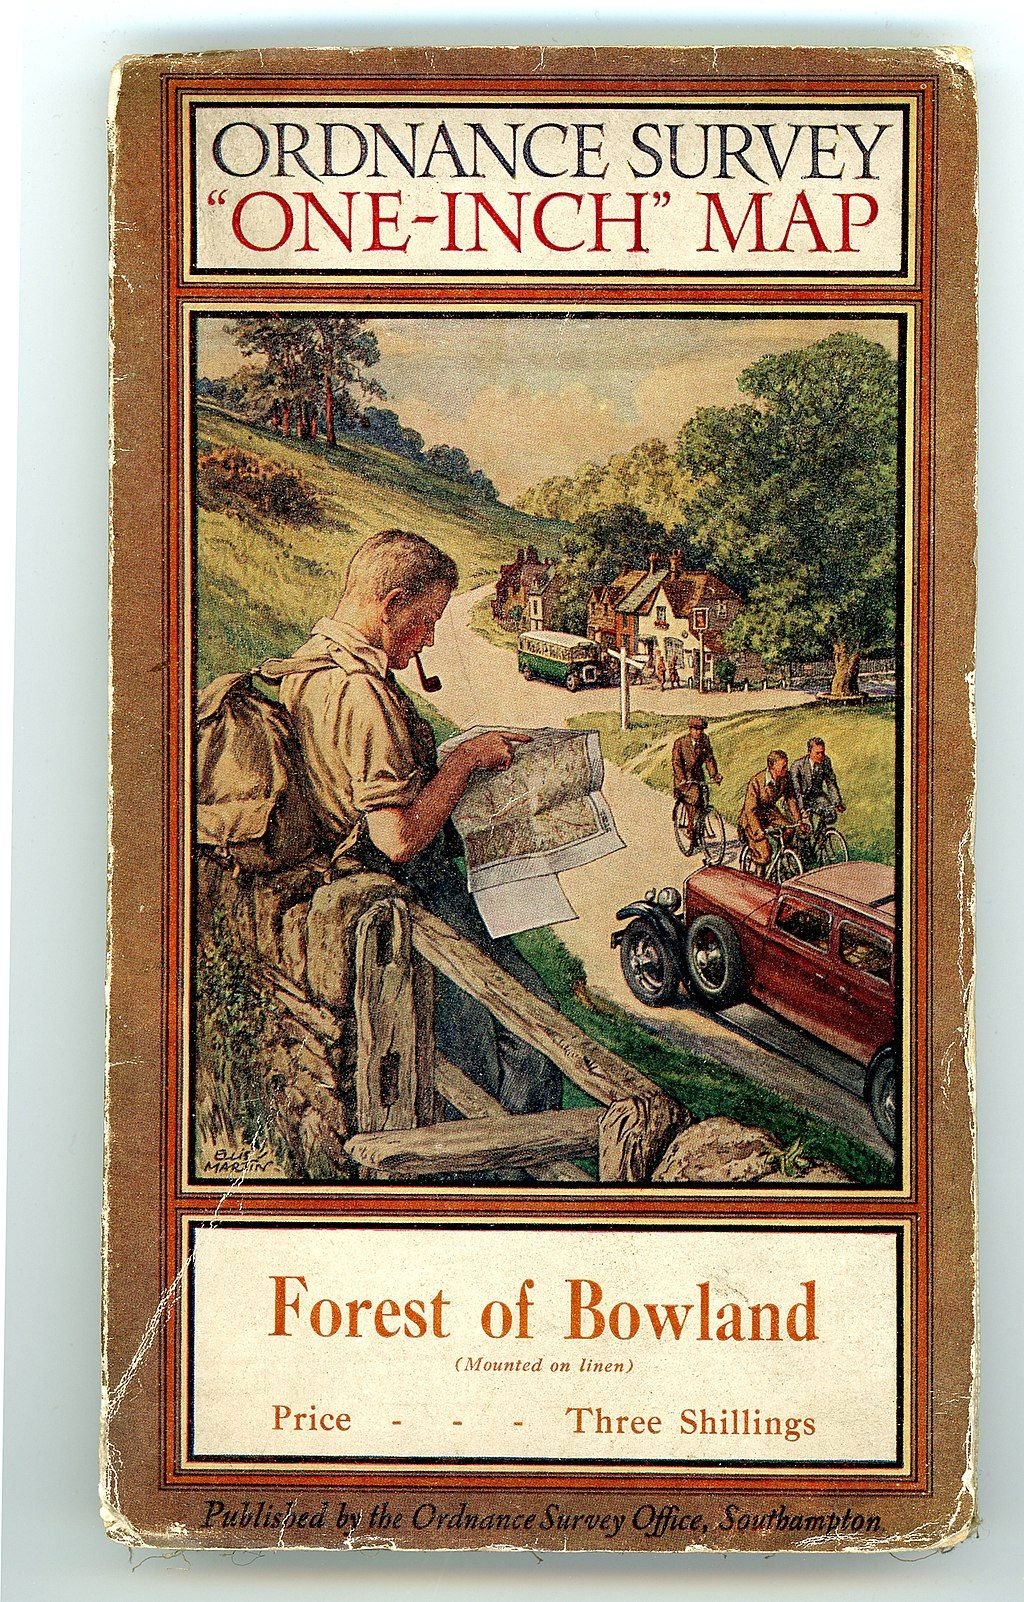
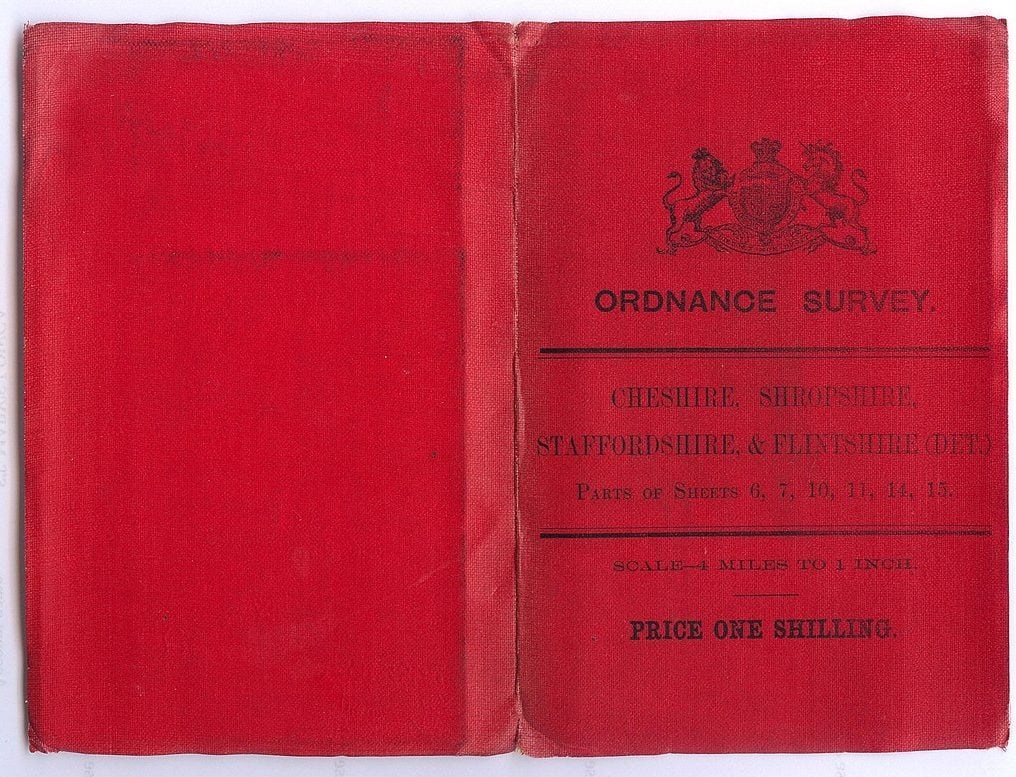
Lots happened at the turn of the century, as 1800s turned into 1900s. The Ordnance Survey offices in the Tower of London almost burnt down in 1841, so they eventually moved into a spacious new location in Southhampton. The Victorians behaved like Victorians and wanted more maps – and better! After years of dispute over which scale of maps were best, they eventually agreed on six inches to the mile for mountain and moorland, 25 inches to the mile for rural areas… all the way up to ten and a half feet to the mile for built-up areas. Glad we sorted that one out then.

Meanwhile, Ordnance Survey developed better and quicker ways to print maps. They started printing them in colour and using aerial photography to help get the features right on the maps. As rambling and outdoor pursuits became an ever popular Victorian pass time, so increased the demand for actually knowing where you and where you’re going. Walking in circles can be fun, but it helps to know where that circle was.
During World War One, Ordnance Survey went back to its military roots and helped create accurate maps of the battle areas. The golden age of plum pudding parties in Ireland was well and truly over. Surveyors grovelled in the trenches like everyone else, plotting the lines. Some 20 million maps were printed for the war effort. That’s a lot of paper.
Here we go again!
After the First World War, everyone wanted a map. There was a huge boom in hiking, cycling and outdoor activities. People started to think of maps as essential. So, in 1935, it was decided to do the whole triangulation process again to make even better maps. The Retriangulation of Great Britain was launched (aka Return of the Triangles or The Triangles Strike Back). The difference was that now there would be a permanent reminder or the triangulation process.
At this point Ordnance Survey launched the metric national grid system (yep, before this there were no grid references) and with it the 1:25 000 scale map…
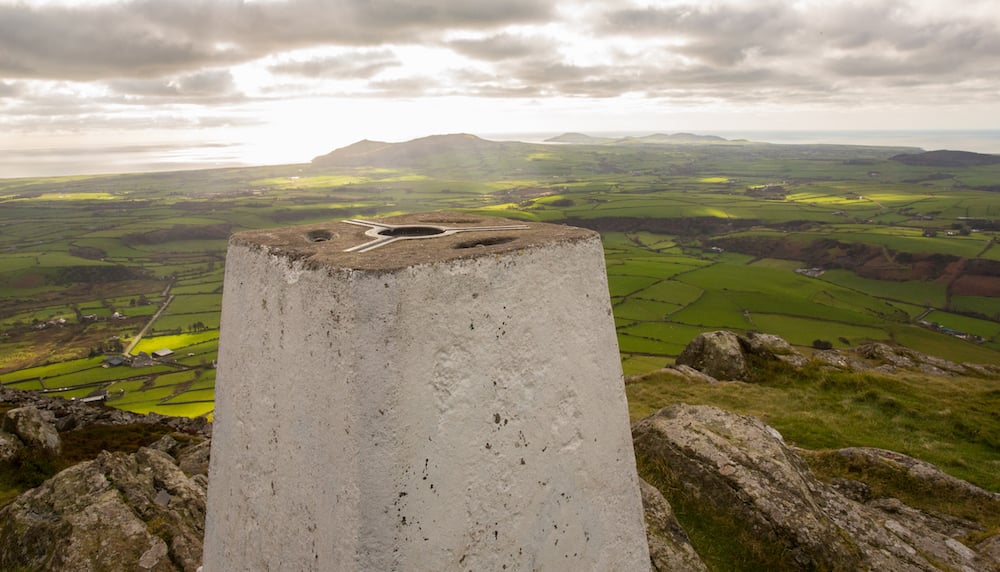
Here, right at the end of our story, comes the birth of the iconic trig point (or, as Sheldon would say, a triangulation pillar). These little concrete pillars (over 6000 of them) were built across the country – and many remain today. They were designed to house the surveyors’ theodolites and painted white to make it easier to line the angles up. At this point Ordnance Survey launched the metric national grid system (yep, before this there were no grid references) and with it the 1:25 000 scale map – which was considered very modern for using kilometres.

In the Second World War, the map makers were again kept very busy, producing over 300 million maps. Apparently some 120 million were used on the Normandy Landings alone. The biggest change after the end of the war was that Ordnance Survey became completely civilian (although the last military personnel only left in 1983). They launched forth with new maps, every detailed survey data and the power of computer technology coming quickly behind them.
The Retriangulation was finished in 1962 and aerial photography made continuous revisions possible.
Ordnance Survey maps in the present day
Nowadays, up to 20,000 changes are put into the database daily, thanks to field surveyors, global navigation satellite systems, remote sensing and a range of advanced geographical information systems (GIS) tools and software. William Roy wouldn’t believe his eyes!
This data is used to produce many different types of maps. The most well known are the OS Landranger and OS Explorer Maps, alongside its road maps. The Explorer maps, at a 1:25,000 scale (4cm = 1km in the real world) are best for walking, running and hiking. The Landranger has a scale of 1:50,000 (2cm = 1km), meaning a larger area is covered in less detail. This makes it perfect for holidays and seeking out tourist attractions.
If you're digitally savvy, you can even download the OS Map App, which encompasses the whole of Great Britain. But to us there's something special about tracing your finger across the map, trying to find your route. We'd prefer to battle with wind and rain than to worry about a flat phone battery!
Well that’s a whole lot of trivia you can save up for your next outdoor-themed pub quiz! Or maybe for casual remarks next time you walk past a trig point.
Book in your next adventure holiday if you haven’t got one lined up.